

Business Intelligence
Making business decisions based on intuition rather than data is a risk no company can afford. InitiumX's nearshore BI team transforms your scattered data into interactive dashboards and executive reports that give you complete real-time visibility into your business performance. Working in US time zones and at significantly lower cost than domestic BI teams, we connect multiple data sources — your ERP, CRM, e-commerce platforms, spreadsheets, and databases — to create a unified view of the business. Our data analysts work with you to define the most important KPIs for each department (sales, finance, operations, marketing) and present them visually in clear, actionable formats. We implement Power BI, Tableau, or Looker Studio based on your needs and existing tech stack. We also configure automated alerts that notify you when a critical metric deviates from target, so you can act before a small problem becomes a large one. If your team still compiles reports manually in Excel every week, our nearshore BI team can eliminate that overhead and give them that time back.
Request Quote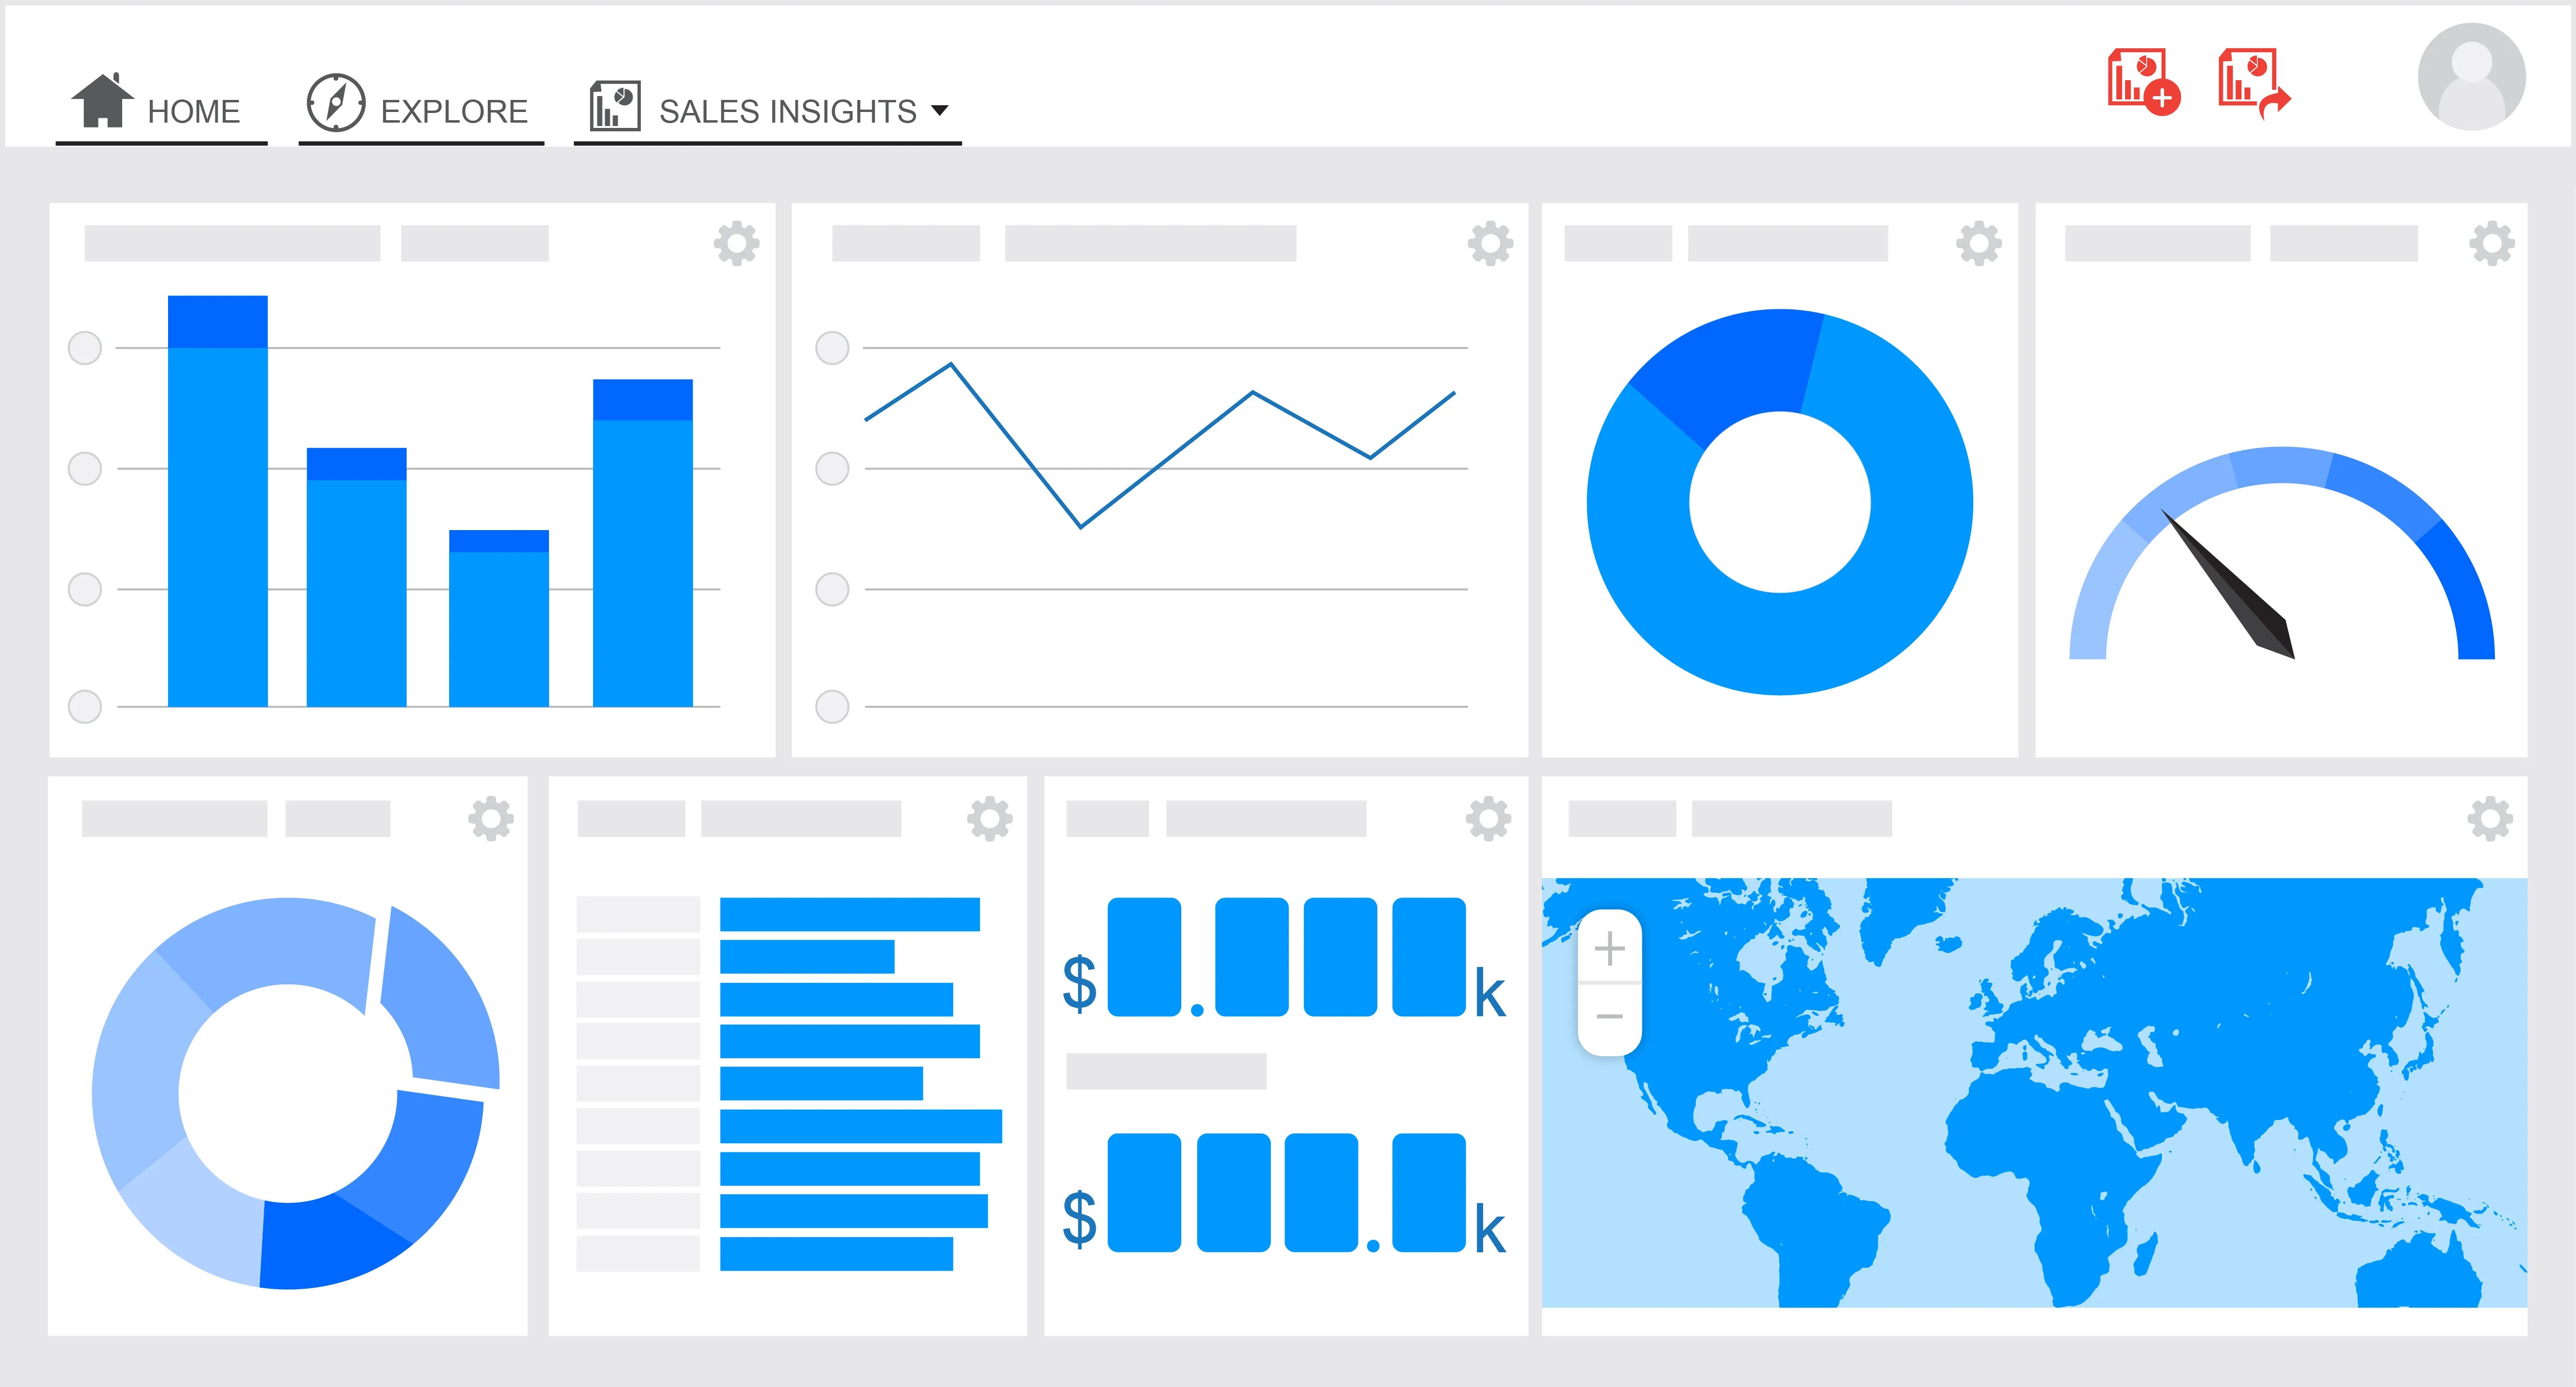
Key Benefits ✓
Real-time interactive dashboards updated automatically
Advanced data visualization with charts, maps, and trends
Integration with ERP, CRM, e-commerce, and other sources
Custom KPIs by business area and department
Automatic alerts when metrics deviate from targets
Elimination of manual Excel reporting cycles
Access from any device with role-based permissions
Historical trend analysis for forecasting and planning
Solution Types
Different types of solutions we develop
Executive Dashboard
A consolidated view of the most important business indicators for C-level and senior management. Monthly sales, YoY growth, profitability by business line, and deviation alerts. Designed to be reviewed in 5 minutes with clear decision triggers — not cluttered with unnecessary detail.
Sales & Marketing BI
Analysis of sales team performance, funnel conversion rates, campaign ROI, customer LTV, and market trends. Integrates data from CRM, digital advertising, and e-commerce platforms into a single view so revenue leaders have full visibility over the entire customer acquisition journey.
Operations & Finance BI
Dashboards for finance, operations, and supply chain showing real-time cash flow, costs by department, inventory turnover, operational efficiency, and margins. Connected directly to your ERP for always up-to-date figures without manual data entry.
Self-Service Analytics
We implement BI platforms with self-service capabilities where business users can build their own reports and explore data without depending on IT. Includes user training, data catalog, and governance framework to maintain consistency across the organization.
Our Process
Methodology we follow to deliver exceptional results
Requirements Gathering
We identify your data sources, critical KPIs by area, and the business questions you need to answer. We prioritize the highest-impact reports to deliver value quickly.
Data Integration
We connect all your data sources, clean and unify the information into a consistent data model that serves as the reliable foundation for all reports and dashboards.
Dashboard Design & Development
We design and build dashboards in the selected tool, applying data visualization best practices to ensure information is clear, accurate, and easy to interpret by business users.
Delivery & Training
We deliver the dashboards, train users to interpret them, configure automatic updates and alerts, and provide 30-day post-delivery support to ensure successful adoption.
Technologies We Use
Cutting-edge tools and frameworks
Frequently Asked Questions
Answers to the most common questions about Business Intelligence
What is the difference between Business Intelligence and web analytics?
Web analytics focuses on user behavior on websites and digital channels. Business Intelligence covers all company data: sales, finance, operations, inventory, HR. BI is a holistic view of the entire business, not just the digital channel performance.
How long does a BI project take?
An initial dashboard connected to 1-2 data sources can be ready in 2-3 weeks. Full projects with multiple departments, complex integrations, and data modeling take 2-4 months.
Which BI tool do you recommend?
It depends on your ecosystem. Power BI is ideal if you already use Microsoft 365. Looker Studio is free and excellent for Google data. Tableau offers the most advanced visualizations. We advise on the best option for your specific situation and existing infrastructure.
How does your nearshore model work for BI projects?
Our team in Honduras works in US time zones, enabling daily collaboration with your stakeholders. You get senior BI analysts and data engineers at 40-60% lower cost than a US-based team, with the same quality standards and communication practices.

Ready to get started?
Contact us today and discover how we can help you with Business Intelligence
Request Free Consultation