Custom Web Analytics Setup: Beyond Google Analytics in 2026

InitiumX Team
Web Analytics Specialists
GA4 launched as the mandatory replacement for Universal Analytics in 2023, and most businesses made the switch because they had no choice. What they got was a more complex interface, a different data model, and a learning curve that most marketing teams are still working through in 2026.
The deeper problem is not GA4’s complexity. It is that businesses treating GA4 as their entire analytics stack are seeing what happened on their website — page views, session counts, event completions — without understanding why it happened. And the “why” is where optimization lives.
GA4 alone is telling you what happened. A full analytics stack tells you what happened, why, and what to do about it.
GA4 Limitations Most Businesses Hit
GA4 is a powerful tool. It is also genuinely limited in ways that matter for decision-making.
Sampling at scale. In reports that exceed GA4’s row limits, data gets sampled. If your business runs at any significant traffic volume, some of your reports are approximations, not actuals. GA4 360 eliminates this but costs $50,000+ per year.
No session recordings or visual behavior data. GA4 shows you that 70% of users leave a landing page after 15 seconds. It does not show you what they saw, what they clicked on, or where they stopped scrolling before leaving. You have the outcome without the context.
Attribution limitations in a cookieless world. With third-party cookies increasingly blocked and iOS privacy changes reducing signal quality, GA4’s client-side tracking misses a growing percentage of conversions. The gap between reported conversions and actual conversions widens every year.
Funnel analysis requires configuration that most setups never complete. GA4 funnels are powerful when set up correctly. Most implementations have incomplete event tracking, which means the funnels they report on are missing significant chunks of the actual user journey.
Reports are broad, not operational. GA4 answers “what is the trend?” more easily than “what should I change on this specific page today?” The latter requires additional tooling.
The Full Analytics Stack
A complete web analytics setup in 2026 combines GA4 with complementary tools that fill its gaps.
GA4 handles traffic trends, acquisition channel analysis, goal tracking, and audience building for ad platforms. It is the foundation. The issue is treating it as the ceiling.
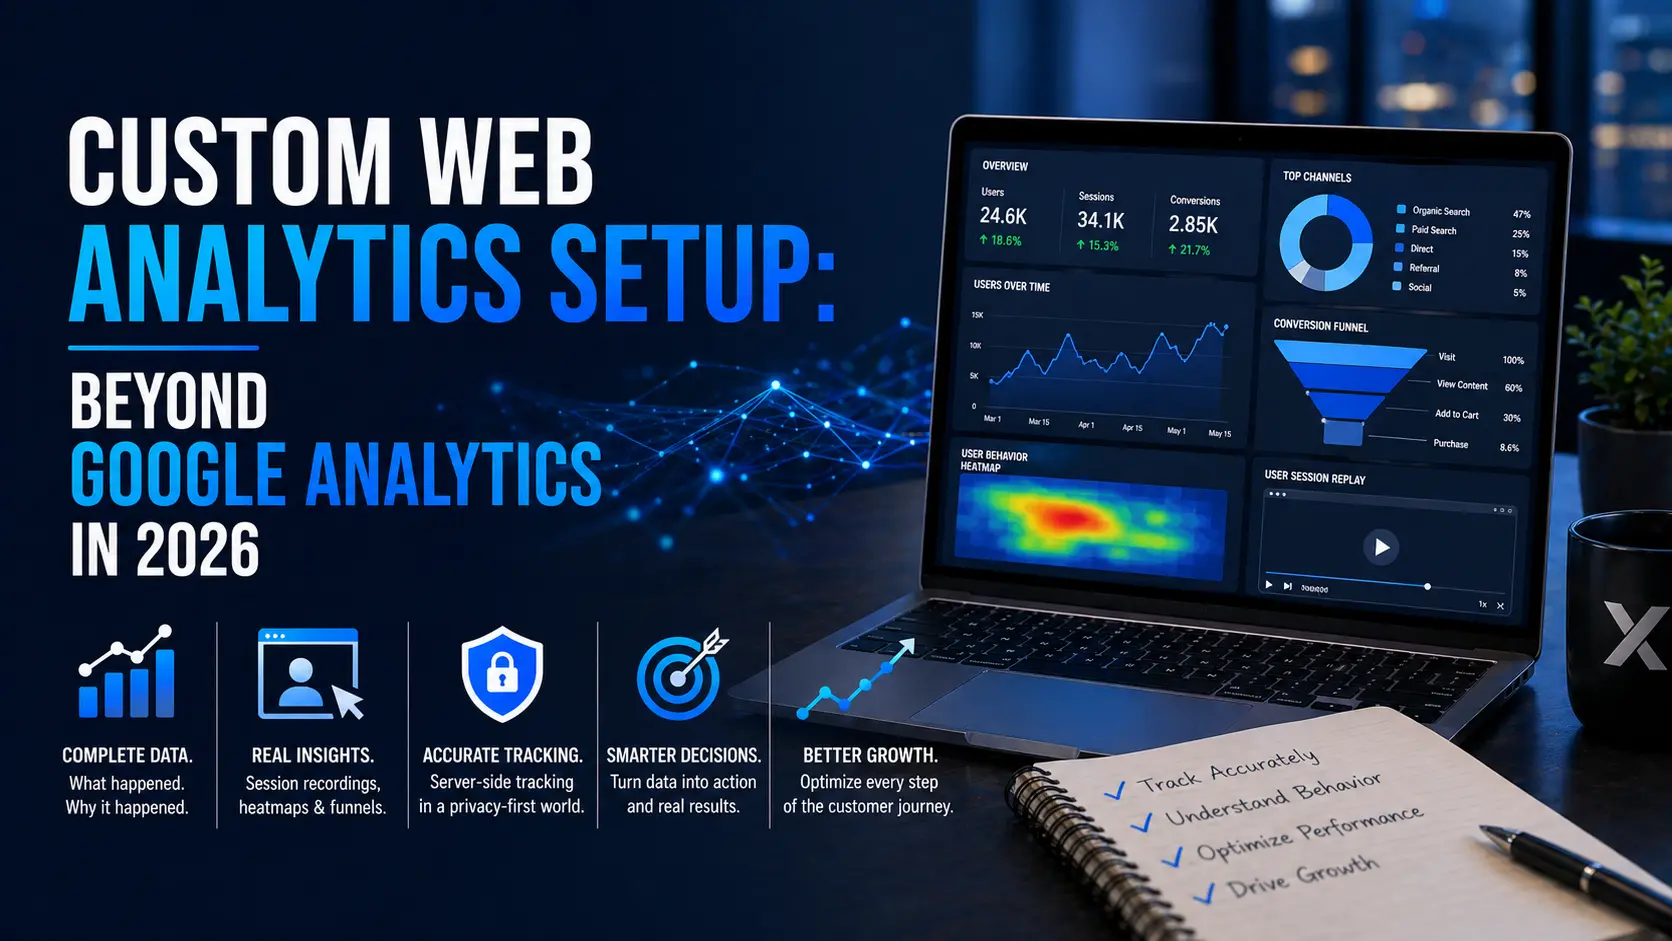
Heatmap tools (Hotjar, Microsoft Clarity, or Mouseflow) show you where users click, how far they scroll, and which elements attract or repel attention. A heatmap can reveal in 10 minutes what a conversion rate optimization consultant would take weeks to diagnose through analytics alone. Microsoft Clarity is free and integrates with GA4.
Session recording captures individual user sessions as video replays. When a form has an unusually high abandonment rate, session recordings show you whether users are confused by a specific field, hitting a technical error, or simply losing interest. This is qualitative data that quantitative tools cannot provide.
Funnel analysis tools (or properly configured GA4 funnels) map the exact steps users take from first visit to conversion, and show precisely where the population drops. This is the most actionable data in analytics — it tells you which step to fix first.
A/B testing tools close the loop. Analytics identifies the problem. Testing validates the solution. Without testing, you are guessing about fixes. Tools like Google Optimize’s successor, VWO, or Optimizely connect hypothesis to evidence.
InitiumX offers web analytics services that configure this full stack — not just GA4 installation, but the complete instrumentation that turns a website into a data asset.
Server-Side Tracking and Why It Matters in 2026
Client-side tracking — the standard method where a JavaScript tag fires in the user’s browser — is losing accuracy. Ad blockers block it. iOS privacy features suppress it. Safari’s Intelligent Tracking Prevention limits the cookie lifespan to 7 days. In some industries, 25-40% of actual conversions go untracked by client-side implementations.
Server-side tracking moves the tracking logic from the user’s browser to a server you control. The event fires server-to-server, bypassing ad blockers and browser restrictions entirely.
The practical impact: more complete conversion data fed back to Google Ads means the algorithm has better signal to optimize toward. Campaigns that appeared to be underperforming improve measurably when they have access to the full conversion dataset. Some businesses see 15-30% more reported conversions after implementing server-side tracking — not because conversions increased, but because they were always happening and now they are being captured.
Server-side tracking setup requires technical implementation: a Google Tag Manager Server container, a server (typically a small cloud instance), and event mapping to ensure data flows correctly. It is not a one-click setup, but it is increasingly the baseline for any serious paid media operation.
Custom Dashboards That Actually Drive Decisions
Most GA4 dashboards show data. Useful dashboards answer questions.
The difference is in design. A dashboard built around reporting tells you what all the metrics were last month. A dashboard built around decisions tells you whether the business is on track, where the problems are, and what changed since last week.
An operational analytics dashboard for a typical business should answer:
- Are we on track for monthly conversion targets? (traffic, conversion rate, leads)
- Which acquisition channels are improving or declining?
- Which landing pages have conversion rates below the site average?
- Where in the funnel is the largest drop-off happening?
- What is the cost per acquisition by channel, and is it trending up or down?
Tools like Looker Studio (formerly Google Data Studio) connect to GA4, Google Ads, Meta Ads, and other data sources to build these dashboards without requiring a data engineering team. The key is structuring them around the questions leadership actually needs answered, not the default reports that analytics tools produce.
InitiumX builds custom Looker Studio dashboards alongside analytics setup engagements, ensuring the data infrastructure produces reports your team will actually use to make decisions.
How a Web Analytics Agency Sets It Up
A professional analytics setup engagement typically covers:
Week 1 — Audit. Review what is currently tracked, what is missing, and what is tracked incorrectly. Most GA4 implementations have significant gaps in event tracking and broken conversion goals.
Week 2 — Implementation. Rebuild or extend the tracking layer through Google Tag Manager. Configure all conversion events with correct values. Set up server-side tracking if applicable. Verify data accuracy across devices and browsers.
Week 3 — Tooling. Install and configure supplementary tools — heatmaps, session recording, funnel tracking. Connect all data sources to a central reporting layer.
Week 4 — Dashboards and handoff. Build operational dashboards tailored to the team’s decision-making process. Train internal stakeholders on how to use the data. Document the full implementation for future reference.
The result is a web analytics setup that produces accurate, complete data about user behavior and connects that data to business outcomes — leads, revenue, and cost per acquisition.
Get a free analytics audit from InitiumX — we’ll review your current GA4 implementation and identify exactly what you are missing and what it is costing you.
InitiumX Team
Web Analytics Specialists
Software development and digital transformation expert at InitiumX.